Calculating downtime

I need some assistance with calculating downtime. I currently have a table being populated every 15 minutes with results from SiteScope.

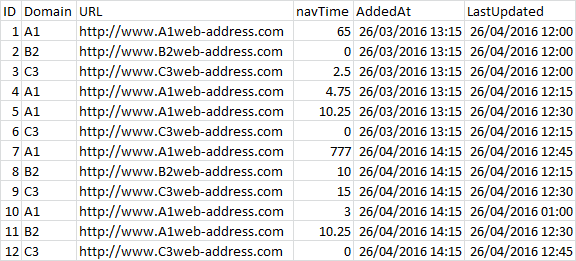
  • Columns are: ID, Domain, URL, navTime, AddedAt, LastUpdated
  • navTime = 0 or navTime >= 65 should be considered downtime
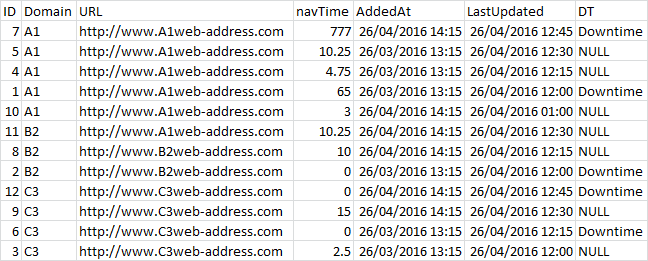
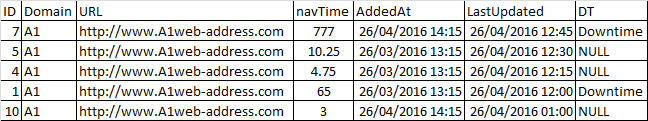
  • downtime should be calculated per URL since there are multiple entries for each URL
  • I would imagine that calculating down to the minute should be fine

My idea is to look at each rows LastUpdated entry for a specific URL, and DATEDIFF it with the LastUpdated entry of the previous row for that specific URL, and to calculate this ongoing. Then, for each specific URL, those minutes need to be added up in another column. From there, with a start date and end date, I can come up with downtime.

Problem is, I don't know sql query very well and this seems complex to me. I've been able to come up with some queries that work, but putting it all together is epic fail.

If you fill the table with dummy data and your expected result you will get a better response

declare @table table
(
ID int identity(1,1)
,Domain varchar(255)
,URL varchar(255)
,navTime int
,AddedAt time
,LastUpdated datetime
)

insert into @table
values
('Any','http://www.web-address.com','65','13:15',getdate()),
('','','','',getdate()),
('','','','',getdate())

select * from @table

declare @table table
(
ID int identity(1,1)
,Domain varchar(255)
,URL varchar(255)
,navTime decimal(5,2)
,AddedAt datetime
,LastUpdated datetime
)

insert into @table
values
('A1','http://www.A1web-address.com','65','2016-03-26 13:15','2016-04-26 12:00:00.000'),
('B2','http://www.B2web-address.com','0','2016-03-26 13:15','2016-04-26 12:00:00.000'),
('C3','http://www.C3web-address.com','2.5','2016-03-26 13:15','2016-04-26 12:00:00.000'),
('A1','http://www.A1web-address.com','4.75','2016-03-26 13:15','2016-04-26 12:15:00.000'),
('A1','http://www.A1web-address.com','10.25','2016-03-26 13:15','2016-04-26 12:30:00.000'),
('C3','http://www.C3web-address.com','0','2016-03-26 13:15','2016-04-26 12:15:00.000'),
('A1','http://www.A1web-address.com','777','2016-04-26 14:15','2016-04-26 12:45:00.000'),
('B2','http://www.B2web-address.com','10','2016-04-26 14:15','2016-04-26 12:15:00.000'),
('C3','http://www.C3web-address.com','15','2016-04-26 14:15','2016-04-26 12:30:00.000'),
('A1','http://www.A1web-address.com','3','2016-04-26 14:15','2016-04-26 01:00:00.000'),
('B2','http://www.A1web-address.com','10.25','2016-04-26 14:15','2016-04-26 12:30:00.000'),
('C3','http://www.C3web-address.com','0','2016-04-26 14:15','2016-04-26 12:45:00.000')

select * from @table

What do you expect as your result?

With the above fake data, I'm thinking that I need to calculate MinutesDown from the LastUpdated column.

I need to look at each row individually,
if navTime is = 0 or navTime is >= 65 then consider it downtime. If true then compare the LastUpdated entry to the next row for that URL and find DATEDIFF as MinutesDown. If navTime is between 0 and 65 then minutes down is 0

I could then calculate downTime based on the StartDate being the very first datetime in the table for that URL, and EndDate of the current date.

End Result is down time as a percentage.

Can you change the data below to how you want the end result to look like?

The top 12 rows are fake data.

The small table below that is a report that I would like to have in the end.

The AvgUptime is calculated by adding up all LIKE rows and dividing by the number of those rows.

Ex.
AvgUptime for A1 URL =(L2+L5+L6+L8+L11)/5