Hi Guys,
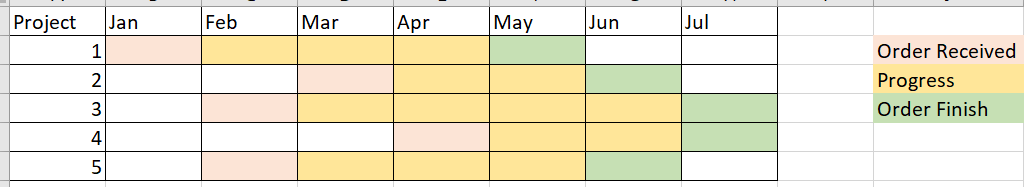
I have a PowerBI task that I am not familiar. How to create a timeline like this in power BI?
Cheers,
Susan
Hi Guys,
I have a PowerBI task that I am not familiar. How to create a timeline like this in power BI?
Cheers,
Susan
It will be difficult for us to advise you without some sample data that you're working with, plus an example of the output that the sample data would generate. Any additional information on this would be most helpful.
Based on the example you provided, it doesn't look like a typical timeline representation. Questions that I would ask about the data:
What data elements/attributes determine a "Project"?
What elements/attributes determine order status like "Received", "Progress", and "Finished"? Are these specific values that are stored? Or are they calculated from other items?
In the meantime, I'd suggest checking out the Guy In a Cube channel on YouTube:
This video talks about timelines, although it may not be specific to your example, it should offer some ideas:

There are other timeline videos as well:
Regarding the formatting/highlighting, you can search the Guy In a Cube videos for "conditional formatting", which you can also do in Excel.
Speaking of Excel, unless you have a specific requirement to present this in PowerBI, I think you're better off doing it in Excel, it will probably be easier. You can most likely prototype it in Excel and then build it in PowerBI if you need to.
Hi @robert_volk ,
Thank you for your help. I am sorry if my information doesn't make sense. I am really new in PowerBI.
The Project is basically the project id. We have a table in SQL with fields:
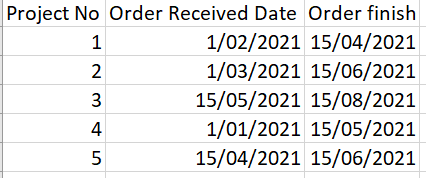
I hope this give you some information about elements/attributes of the Project, Order Receive, Progress and Finish Date.
Thanks again @robert_volk.
Cheers,
Susan
Why are you using powerbi for a simple grid report and not ssrs?
Hi @yosiasz ,
The record will come from SQL database. I am using PowerBI because basically business people is trying to use that to make a man power estimation for their project. They will break down from that chat to make an estimation how many people they need each month from start of the project until finish and they want it interactive in PowerBI. I have a background in SQL server but this is my first time working on PowerBI. I put that on grid to make it easy for the illustration of the data structure only.
Cheers,
Susan