Hi Experts !
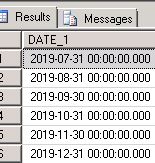
All day trying but getting failed , the horizontal axis properties ( date ) issue . When I trying to run the report from report builder e.g 1-July-19 date selected, the graphs horizontal axis the date start from 01-August -19 as shown in screenshot.
is there any data to plot for the first date: 1-July-19 ?
Yes data is available for 31-July-19

Are you sure the query is returning that data in Report Builder? The datetime picker actually sends a date and time value to SQL Server and if your code is not stripping the time then your data will not include the first date.
What is the SQL code that is being executed?
Sir the executed SP is below .
DECLARE @Startdate DATETIME
DECLARE @EndDate DATETIME
SET @Startdate =DATEADD(mm,DATEDIFF(mm,0,@Starddate2),0)  ---- Run on any date will calculate  First date of the month.
SET @EndDate = dateadd(month,1+datediff(month,0,@Enddate2),-1)  --- Run on any date will calculate  month to and maximum value.


SELECT  [DATE_1]=dateadd(month,1+datediff(month,0,START_DATETIME),-1),
         [ITEM]=ITEM_NAME ,
         [STP] =VAL1
From
TABLE
Where  START_DATETIME > = DATEADD(month,DATEDIFF(MONTH,START_DATETIME,@Startdate),START_DATETIME)
    AND  START_DATETIME  < DATEADD(month,DATEDIFF(MONTH,START_DATETIME,@EndDate)+1,START_DATETIME)
GROUP BY ITEM_NAME,dateadd(month,1+datediff(month,0,START_DATETIME),-1)
By Playing with horizontal axis properties it fixed auto 


