I am developing an application which is supposed to have 2000 concurrent users. It is a .Net based application with Sql server backend.
I have a application server:
Windows server, 20 Core CPU, 12 GB RAM.
Database server: 10 core cpu, 10 GB RAM, sql server web edition with 10 core license.
The problem is:
Initially the application response time for 100 concurrent user is 4 sec.
When above 700 concurrent user logs in, application response time degrades to 45 sec though the CPU and RAM usage for both App and database server is less than 50% utilization. The sql profiler shows that the Stored Procedure which initially took milli second to execute when less users took 4sec when more users logged in.
I am unable to identify the bottle next. It is not CPU and RAM because the utilization is less than 50%. So where is the problem.
I am trying to optimize the Stored Procedure and Coding but it will take more time and I am running out of time. Hence can anyone suggest:
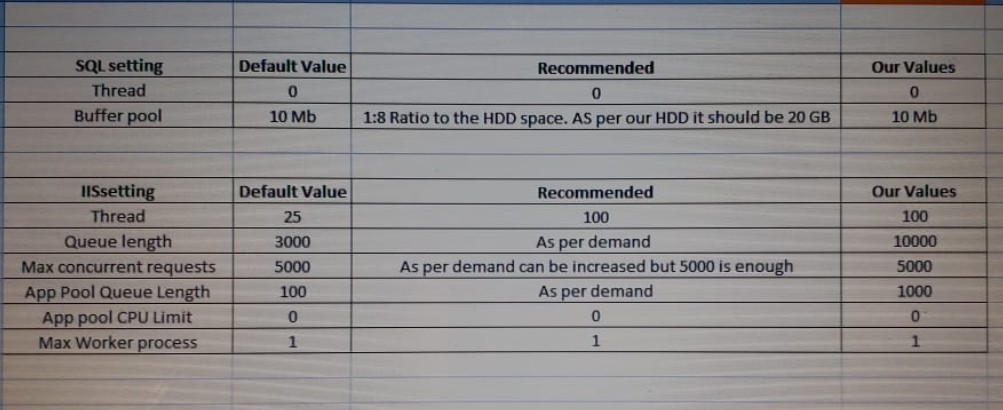
Any specific settings in SQL or IIS server setting which is capping the server performance
Or
SQL web edition license needs to be upgraded for more core from currentb10 core license
Or
SQL server license needs to be upgraded from web to standard or enterprise edition.
Or any other suggestion.
Does any one know a SQL server performance Tunner expert or any person who could guide me.
The quickest test you can do perhaps is to turn on query store if it is not already, let the system run until query store has some data and look at what query store tells you.
Microsoft has done a great job with the query store - it is easy to learn, easy to set up, and the built in views offer great information. In your case, I would look at the built in "Queries with High Variation" and "Regressed Queries". Once you identify the query plans that cause the problem, you can delve into the details - the query plans are available right there as well.
There are lot of articles and help on the web. For example this is a good introduction.
What is max memory set to? Does windows have enough memory to run?
What is MAXDOP set to and what is the cost threshold? I would start by setting MAXDOP to 1 and then slowly increasing it with a cost threshold of at least 50.
etc
Also wait stats and latency can offer clues to performance problems:
What version of SQL Server?
How is the server configured - is it a VM and if so, how many sockets and cores are configured?
In SQL Server - what is the max memory setting?
Web Edition is limited to the lesser of 4 sockets or 16 core - this could part of the problem.