If you want better help more quickly, then here’s one way to create the DDL and Sample Data.
--===== Create and populate the #MyHead test table.
-- DROP TABLE IF EXISTS #MyHead; --For reruns and changes
GO
 SELECT  Period   = CONVERT(DATE,v1.Period)
        ,Category = CONVERT(VARCHAR(10),Category)
        ,X        = CONVERT(INT,v1.X)
        ,Y        = CONVERT(INT,v1.Y)
   INTO #MyHead
   FROM (VALUES
         ('01/10/2025','Cat 1',31   ,42     )
        ,('01/10/2025','Cat 2',129  ,141    )
        ,('01/10/2025','Cat 3',59   ,71     )
        ,('01/10/2025','Cat 4',1323 ,1524   )
        ,('01/10/2025','Cat 5',426 	,480    )
        ,('01/09/2025','Cat 1',1    ,1      )
        ,('01/09/2025','Cat 2',1    ,1      )
        ,('01/09/2025','Cat 3',67   ,71     )
        )v1(Period,Category,X,Y)
;
Then, we can demo some code…
Lookup all of the GROUPING(), GROUPINGID(), ROLLUP, and CUBE keywords. If you don’t want the category subtotals section, change the word CUBE to ROLLUP.
Notice the ORDER_BY. You have to sort by the GROUPING() of each column and then the column to get the output in the correct order. Some will tell you that you don’t need the ORDER BY because it will auto-magically come out in the correct order… That’s mostly true but I never trust default sort orders for anything anymore.
Also, I left the GrpID column in the output just to show you what the GROUPING_ID() is returning because it’s essential to make the labels come out nice instead of just being NULLs. You can comment out or remove the GrpID column for production or presentation work.
--===== Solve the problem
 SELECT  Period   = CASE GROUPING_ID(mh.Period,mh.Category)
                    WHEN 0 THEN CONVERT(VARCHAR(20),mh.Period,23)
                    WHEN 1 THEN CONVERT(VARCHAR(20),mh.Period,23)
                    WHEN 2 THEN 'Sub Total'
                    WHEN 3 THEN 'Grand Total'
                    END
        ,Category = CASE GROUPING_ID(mh.Period,mh.Category)
                    WHEN 0 THEN mh.Category
                    WHEN 1 THEN 'Period SunTotal'
                    WHEN 2 THEN mh.Category
                    WHEN 3 THEN REPLICATE('=',15)
                    END
        ,X=SUM(mh.X)
        ,Y=SUM(mh.Y)
        ,GrpID = GROUPING_ID(mh.Period,mh.Category)
   FROM #MyHead mh
  GROUP BY mh.Period, mh.Category WITH CUBE
  ORDER BY GROUPING(mh.Period)  ,mh.Period
          ,GROUPING(mh.Category),mh.Category
;
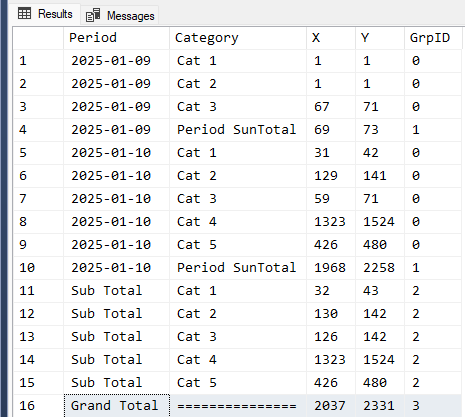
Here’s what the code above returns….
And, yes… this will also produce the same thing even if there are thousands of data rows for each date and category. If you want to make that super fast, then you’ll need to learn a bit about “pre-aggregations for CROSS TABS (that’s what this is) and PIVOTs (which I avoid like the plague because it’s slower and more difficult to get what you want or need).