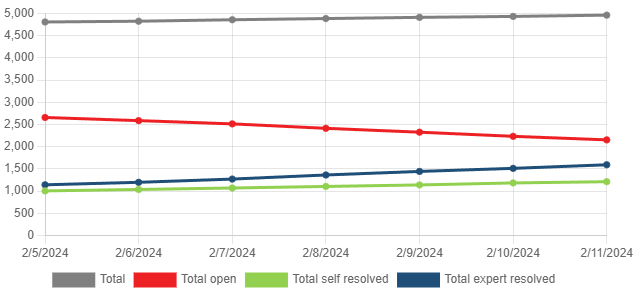
Use case:
We are a company that ships a support ticketing system.
Our customers wants to make the progression of their ticket's statuses over time more visible, in other words: They want to know how many tickets are open on each date, how many tickets were resolved by the person (ticketee) who sent in the ticket (self resolved), and how many tickets were resolved by one their own employees (expert resolved).
All of our tickets have a risk level (high, medium, low). When sending in a ticket, the customer has to select how business critical the issue is, which we then translate to said risk level. We want to filter the data on this risk level.
Example of data inside the Tickets table:
| TicketeeId | RiskLevel | ResolvedDate | ResolvedBy |
|---|---|---|---|
| 13b12472-d43c-417a-98e8-5ab2ae2e569a | 2 | NULL | NULL |
| f9705f3d-f682-4ba8-bddc-000a526155f3 | 1 | 2024-01-18 | NULL |
| 3c4f0313-f640-43c6-bca7-000bb47633b6 | 2 | 2024-02-11 | 13b12472-d43c-417a-98e8-5ab2ae2e569a |
| 1fa97b25-b88c-4e1f-b780-0016d45fc457 | 1 | 2024-02-13 | NULL |
When ResolvedDate is NULL the ticket is still open.
When ResolvedDate is not NULL, the ticket is resolved.
When ResolvedDate is filled and ResolvedBy is NULL, the ticket was resolved by the ticketee (self resolved)
When ResolvedDate is filled and ResolvedBy is not NULL, the ticket was resolved by the employee with the corresponding id.
The query I built returns the desired result but its very slow on large date ranges.
Current query:
DECLARE @OrganizationId UNIQUEIDENTIFIER = '53843114-a53a-43c1-933c-d5f1eb5163cf';
DECLARE @BeginDate DATETIME2(3) = '2024-02-05 00:00:00'
DECLARE @EndDate DATETIME2(3) = '2024-02-11 23:59:59'
DECLARE @RiskLevel INT = 3; -- High risk

CREATE TABLE #TempTable
(
    Date DATETIME2(3) Primary Key,
    TotalTickets INT,
    TotalOpen INT,
    TotalSelfResolved INT,
    TotalExpertResolved INT
)

DECLARE @CurrentDate DATETIME2(3) = @EndDate;

WHILE (@CurrentDate >= @BeginDate)
    BEGIN
    IF (@CurrentDate > GETDATE())
        -- If date is in the future
        INSERT
        INTO #TempTable
            (Date,
            TotalTickets,
            TotalOpen,
            TotalSelfResolved,
            TotalExpertResolved)

        SELECT @CurrentDate, NULL, NULL, NULL, NULL
    ELSE
        INSERT
        INTO #TempTable
            (Date,
            TotalTickets,
            TotalOpen,
            TotalSelfResolved,
            TotalExpertResolved)

        SELECT @CurrentDate,
            SUM(TotalTickets),
            SUM(OpenTickets),
            SUM(SelfResolved),
            SUM(ExpertResolved)
        FROM (
        SELECT COUNT(*) TotalTickets,
                SUM(CASE WHEN ResolvedDate IS NULL OR ResolvedDate > @CurrentDate THEN 1 ELSE NULL END) OpenTickets,
                SUM(CASE WHEN ResolvedDate IS NOT NULL AND ResolvedDate < @CurrentDate AND ResolvedBy IS NULL THEN 1 ELSE 0 END) SelfResolved,
                SUM(CASE WHEN ResolvedDate IS NOT NULL AND ResolvedDate < @CurrentDate AND ResolvedBy IS NOT NULL THEN 1 ELSE 0 END) ExpertResolved
            FROM Tickets t
                INNER JOIN Ticketees ti ON t.TicketeeId = ti.Id
                INNER JOIN TicketeeOrganizations tio ON tio.TicketeeId = ti.Id AND tio.OrganizationId = @OrganizationId -- Only select tickets for a specific organization
            WHERE t.RiskLevel = @RiskLevel AND t.Date < @CurrentDate
        ) AS subselect

    SET @CurrentDate = DATEADD(DAY, -1, @CurrentDate);
    END;

SELECT *
FROM #TempTable;
The resulting data set looks like this:
| Date | TotalTickets | TotalOpen | TotalSelfResolved | TotalExpertResolved |
|---|---|---|---|---|
| 2024-02-05 | 4885 | 2687 | 1035 | 1163 |
| 2024-02-06 | 4902 | 2616 | 1067 | 1219 |
| 2024-02-07 | 4935 | 2543 | 1100 | 1292 |
| 2024-02-08 | 4962 | 2443 | 1135 | 1384 |
| 2024-02-09 | 4989 | 2356 | 1169 | 1464 |
| 2024-02-10 | 5010 | 2263 | 1214 | 1533 |
| 2024-02-11 | 5039 | 2183 | 1242 | 1614 |
We display this data in a nice line chart

I need help to rewrite the query so it is better performing on larger date ranges.