Greetings
given the following data
id,version,result
1,v.1.1, 4
2,v.1.1,2
3,v.1.3,3
4,v.1.2,12
5,v.1.1,13
6,v.1.3,15
7,v.1.2,12
I Want to be able to pivot the data without any aggregation if at all possible, but then I want to make sure the data sample are evenly distributed and filled in with 0 where there is no value.
so in the case of the above data the count is 7 which is uneven, v.1.1 has 3 rows the rest have 2 each. so either fill in the other 2 with 0 values (easier?) or subtract one data row from v.1.1
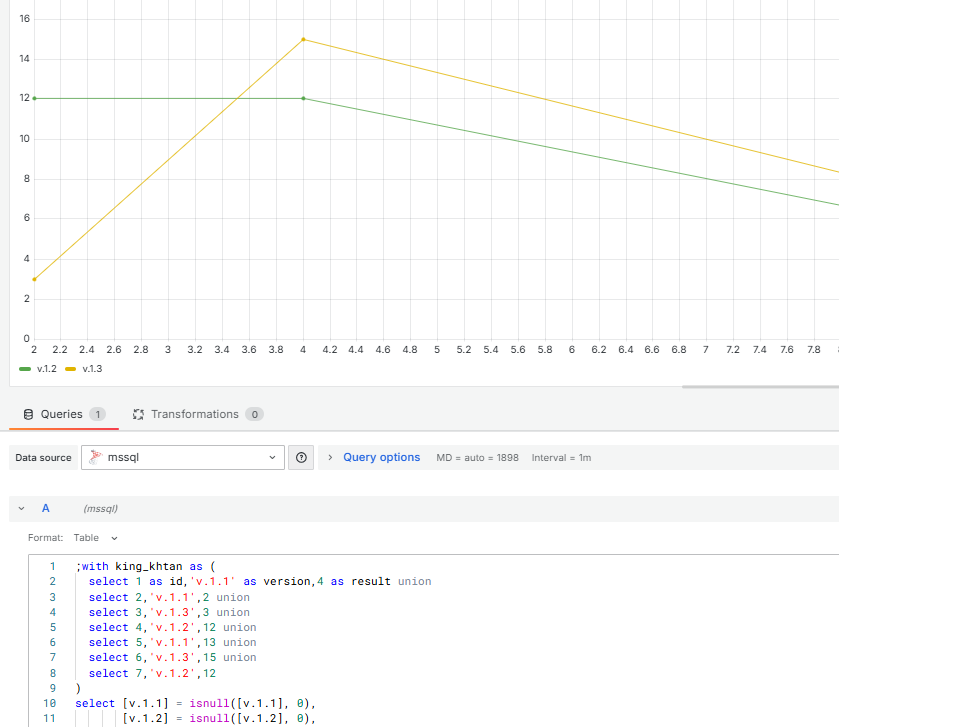
So that in the final analysis I have a pivot that look like following for a grafana trend line chart
v.1.1, v.1.2,v.1.3
4,12,3
2,12,15
13,0,0
by the way the order is important in the case of v.1.1 it would be 4,2,13 based on the id column.
Please let me know if this makes no sense.
Thanks!