hi everyone, I am doing an SSRS report which needs to have a chart that looks like this
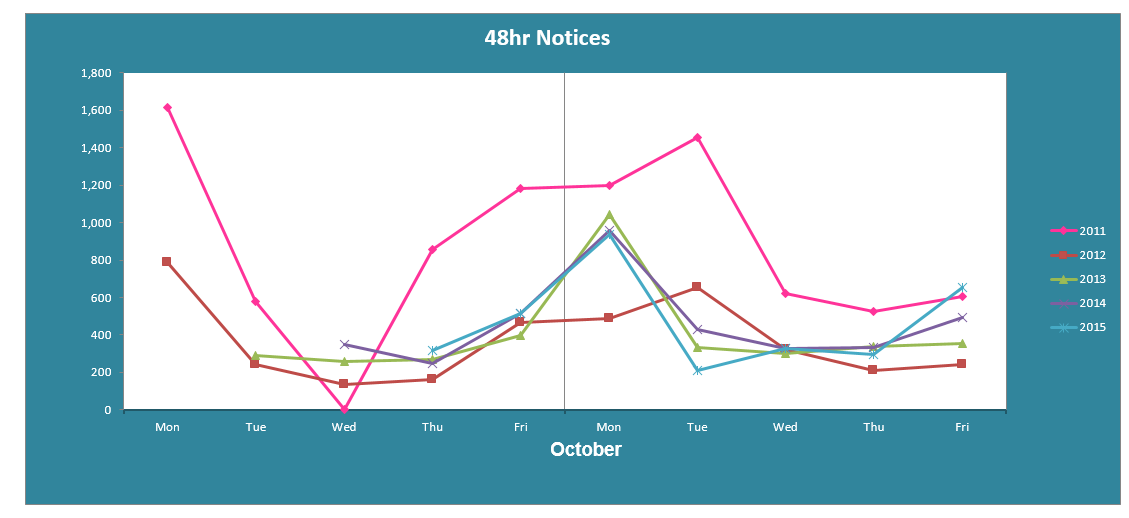
and so far on my ssrs report I have this
http://postimg.org/image/ysbbadz9f/
how could I make my ssrs chart the same on my excel chart?
please help me. thank you.
I think you can get close toexcel but not exactly like the sample you give ( I might be wrong). To get the chart in SSRS, simply create a data source and get a data set ready, then put that as the source of the chart and put in the format you prefer.
Hope this helps
1 Like
thank you for that, but I checked the format of my ssrs chart, it is exactly the same as the format on my excel chart (note: i'm talking about the format only like the line graph and the type of chart) and I don't know why the output still differ. 
you will have to make sure the query return the same number of data points, then the output should be similar. Can you post out the chart that you've got, and others might can help you with that also.
Hi, here's the chart that I am getting
so far there are still gaps because the details on my data base aren't complete yet.
