Heat map data pivot?

I need to create a heat map data for powerbi. I do not want to do too much filter and formatting on powerbi (yes I could it was deemed not maintainable)

here is my sample data and desired result, smells like pivot to me?

	 --   product		1_1		1_2		1_3		1_4		1_5
		--Oreyos		5		0		0		8		2


		declare @heatmap table(product varchar(50), risttitle nvarchar(50), severity int, probability int)

		insert into @heatmap
		select 'Oreyos', 'not sweet enough', 1, 1 union
		select 'Oreyos', 'oki', 1, 1 union
		--1_1 there are 2
		select 'Oreyos', 'not sweet enough', 1, 2 union
		--1_2 there is 1
		select 'Oreyos', 'layers 2 thin', 1, 3 union
		--1_3 there is 1
		select 'Oreyos', 'too crumbly', 1, 4 union
		--1_4 there is 1
		select 'Oreyos', 'anti milk attitude detected', 1, 5 union
		--1_5 there is 1
		select 'Oreyos', 'inside out, no good. need crust on outside.', 2, 1 union
		select 'Oreyos', 'inside out, no good. need crust on outside.', 2, 1 union
		select 'Oreyos', 'inside out, no good. need crust on outside.', 2, 1 union
		select 'Oreyos', 'inside out, no good. need crust on outside.', 2, 1 union
		select 'Oreyos', 'inside out, no good. need crust on outside.', 2, 1 
		--2_1 there is 5

		/*
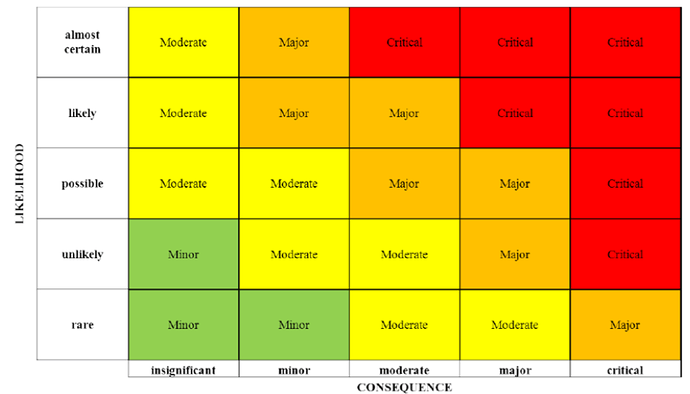
			heat map is 5 x 5
			25 quadrants
			in each quandrant count how many items per product for the specific severity and probability
		*/
		declare @desireheatmap table(product varchar(50), b1_1 int, b1_2 int, b1_3 int, b1_4 int, b1_5 int, b2_1 int)

		--1st column severity 1
		insert into @desireheatmap(product, b1_1, b1_2, b1_3, b1_4, b1_5)
		select 'Oreyos', 2, 1, 1, 1, 1	

		--2nd column severity 1
		insert into @desireheatmap(product, b2_1)
		select 'Oreyos', 5

		select * from @desireheatmap
sorted it out

insert into heatmap
select 'Oreyos', 'not sweet enough', 1, 1 union
select 'Oreyos', 'oki', 1, 1 union
--1_1 there are 2
select 'Oreyos', 'not sweet enough', 1, 2 union
--1_2 there is 1
select 'Oreyos', 'layers 2 thin', 1, 3 union
--1_3 there is 1
select 'Oreyos', 'too crumbly', 1, 4 union
--1_4 there is 1
select 'Oreyos', 'anti milk attitude detected', 1, 5 union
--1_5 there is 1
select 'Oreyos', 'inside out, no good. need crust on outside.', 2, 1 union all
--2_1 there is 5
select 'Oreyos', 'inside out, no good. need crust on outside.', 3, 1 union all
select 'Oreyos', 'inside out, no good. need crust on outside.', 2, 3 union all
select 'Oreyos', 'inside out, no good. need crust on outside.', 2, 4 union all
select 'Oreyos', 'inside out, no good. need crust on outside.', 2, 5 union all
select 'Oreyos', 'inside out, no good. need crust on outside.', 2, 2

SELECT @Columns =  COALESCE(@Columns + ', ','') + QUOTENAME(concat('b', severity, '_', probability))
FROM
(
	select distinct cast(severity as varchar(50)) as severity, cast(probability as varchar(50))  probability 
	  from heatmap	 
) AS B
ORDER BY severity, probability

declare @query nvarchar(1500)

SET @query ='
select product, ' + @Columns + ' from
(
	select product, bucket, RiskCount
	from (
		Select product, count(1) RiskCount,
		       CONCAT(''b'', cast(severity as varchar(50)), ''_'', cast(probability as varchar(50))) as bucket
		  From heatmap
		  group by product, severity, probability
		) a
) p
PIVOT 
(
max(RiskCount)
FOR bucket in (' + @Columns + ')
) a '

exec (@query)

I admit, I have no idea what "b1_1" is supposed to represent. Given the we're dealing with "severity" and "probability", I don't how "b" is supposed to match up to those.

thanks @ScottPletcher b1_1 is just a naming convention I used for bucket 1,1 or quadrant 1,1
b1_1 is the x=1, y=1 quadrant of the 5x5 heat map.

x axis being consequence & y axis being likelihood

without dynamic query as the number of pivot columns are known. 5x5 = 25

use sqlteam
go

create table heatmap(product varchar(50), title varchar(50), severity int, probability int)

insert into heatmap
select 'Oreyos', 'not sweet enough', 1, 1 union all
select 'Oreyos', 'oki', 1, 1 union all
--1_1 there are 2
select 'Oreyos', 'not sweet enough', 1, 2 union all
--1_2 there is 1
select 'Oreyos', 'layers 2 thin', 1, 3 union all
--1_3 there is 1
select 'Oreyos', 'too crumbly', 1, 4 union all
--1_4 there is 1
select 'Oreyos', 'anti milk attitude detected', 1, 5 union all
--1_5 there is 1
select 'Oreyos', 'inside out, no good. need crust on outside.', 2, 1 union all
--2_1 there is 5
select 'Oreyos', 'inside out, no good. need crust on outside.', 3, 1 union all
select 'Oreyos', 'inside out, no good. need crust on outside.', 2, 3 union all
select 'Oreyos', 'inside out, no good. need crust on outside.', 2, 4 union all
select 'Oreyos', 'inside out, no good. need crust on outside.', 2, 5 union all
select 'Oreyos', 'inside out, no good. need crust on outside.', 2, 2

select product, [b1_1], [b1_2], [b1_3], [b1_4], [b1_5], 
          [b2_1], [b2_2], [b2_3], [b2_4], [b2_5], 
		  [b3_1], [b3_2], [b3_3], [b3_4], [b3_5], 
		  [b4_1], [b4_2], [b4_3], [b4_4], [b4_5], 
		  [b5_1], [b5_2], [b5_3], [b5_4], [b5_5] 
   from  (   
			  select product, bucket, RiskCount   
			  from (    
					 Select product, 
							count(1) RiskCount,           
							CONCAT('b', cast(severity as varchar(50)), '_', cast(probability as varchar(50))) as bucket        --select *      
					   From  heatmap src  
					   group by product, severity, probability    
				   ) dataprep  
	      ) prodcount  
	 PIVOT   (  max(RiskCount)  
	            FOR bucket in ([b1_1], [b1_2], [b1_3], [b1_4], [b1_5], 
				               [b2_1], [b2_2], [b2_3], [b2_4], [b2_5], 
							   [b3_1], [b3_2], [b3_3], [b3_4], [b3_5], 
							   [b4_1], [b4_2], [b4_3], [b4_4], [b4_5], 
							   [b5_1], [b5_2], [b5_3], [b5_4], [b5_5])  
			   ) piv


drop table heatmap
1 Like