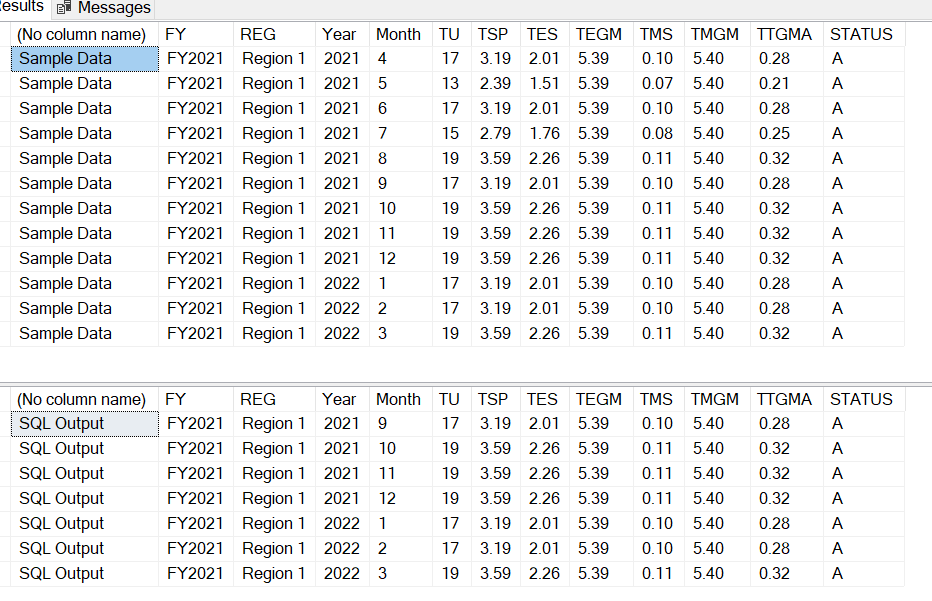
I have a table
| FY | REG | Year | Month | TU | TSP | TES | TEGM | TMS | TMGM | TTGMA | STATUS |
|---|---|---|---|---|---|---|---|---|---|---|---|
| FY2021 | Region 1 | 2021 | 4 | 17 | 3.19 | 2.01 | 5.39 | 0.10 | 5.40 | 0.28 | A |
| FY2021 | Region 1 | 2021 | 5 | 13 | 2.39 | 1.51 | 5.39 | 0.07 | 5.40 | 0.21 | A |
| FY2021 | Region 1 | 2021 | 6 | 17 | 3.19 | 2.01 | 5.39 | 0.10 | 5.40 | 0.28 | A |
| FY2021 | Region 1 | 2021 | 7 | 15 | 2.79 | 1.76 | 5.39 | 0.08 | 5.40 | 0.25 | A |
| FY2021 | Region 1 | 2021 | 8 | 19 | 3.59 | 2.26 | 5.39 | 0.11 | 5.40 | 0.32 | A |
| FY2021 | Region 1 | 2021 | 9 | 17 | 3.19 | 2.01 | 5.39 | 0.10 | 5.40 | 0.28 | A |
| FY2021 | Region 1 | 2021 | 10 | 19 | 3.59 | 2.26 | 5.39 | 0.11 | 5.40 | 0.32 | A |
| FY2021 | Region 1 | 2021 | 11 | 19 | 3.59 | 2.26 | 5.39 | 0.11 | 5.40 | 0.32 | A |
| FY2021 | Region 1 | 2021 | 12 | 19 | 3.59 | 2.26 | 5.39 | 0.11 | 5.40 | 0.32 | A |
| FY2021 | Region 1 | 2022 | 1 | 17 | 3.19 | 2.01 | 5.39 | 0.10 | 5.40 | 0.28 | A |
| FY2021 | Region 1 | 2022 | 2 | 17 | 3.19 | 2.01 | 5.39 | 0.10 | 5.40 | 0.28 | A |
| FY2021 | Region 1 | 2022 | 3 | 19 | 3.59 | 2.26 | 5.39 | 0.11 | 5.40 | 0.32 | A |
Here i want to filter the record based on fiscal year, in this case fiscal year start from April to march.
i want to sum up columns |TU|TSP|TES|TEGM|TMS|TMGM|TTGMA| based on month 4 and year 2021 to month 3 year 2022 . should be group by |FY|REG|STATUS|
Please help me.
