I have a basic bar chart that shows percentage of two fields (failedQTY/inspectedQTY)
Works fine, but I need to figure out how to incorporate the quantities.
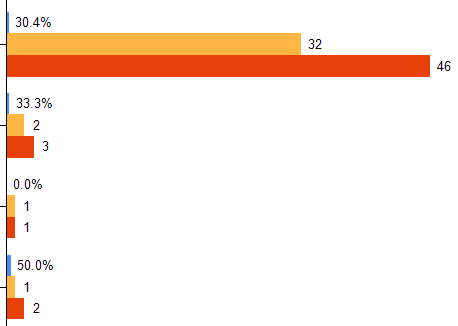
The first bar graph in the attachment you'll see had 46 inspected, but 32 failed, the yield was 30.4%. I need a cleaner way to show the 46 and 32. Ideally next to the percentage, all on one line, but I'm open to suggestions.
Thanks a bunch!