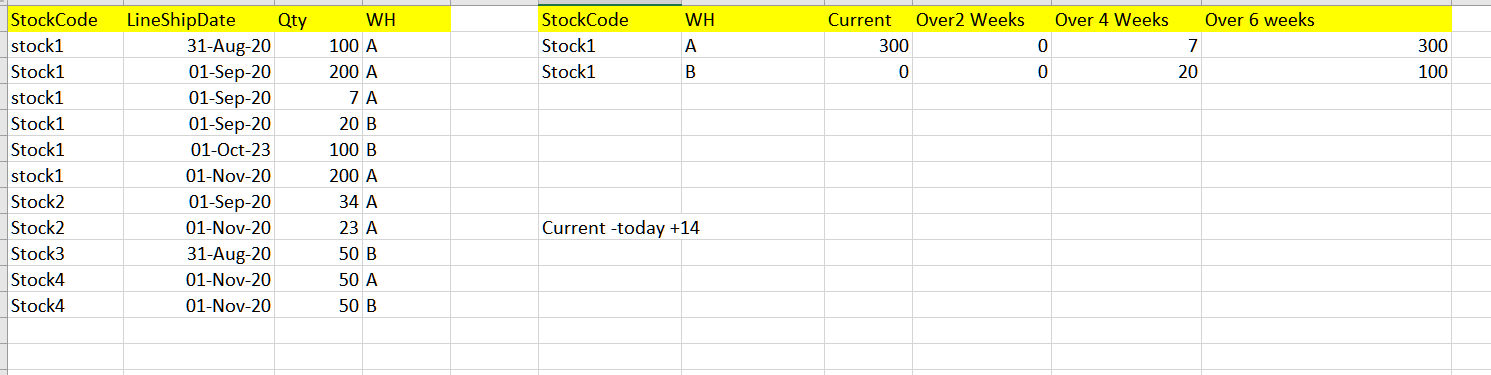
The table displays all items with ship date and qty.
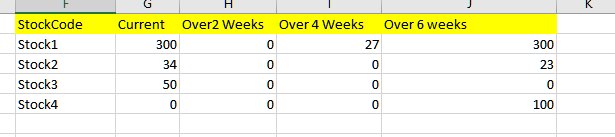
We would like to know how much qty per each stock code we will need to fulfill in the near future. For this I have the ageing buckets.
Current is not to two weeks period , more than 2 weeks, over 4 weeks, and everything over 6 weeks.
In order to achieve that i would need to convert data to the following format:
Can I have some help in creating a view to display the above? thanks
I don't have data to test it with, but this should be very close at least:
SELECT
    StockCode,
    SUM(CASE WHEN DaysAge < 15 THEN Qty ELSE 0 END) AS [Current],
    SUM(CASE WHEN DaysAge >= 15 AND DaysAge < 29 THEN Qty ELSE 0 END) AS Over2Weeks,
    SUM(CASE WHEN DaysAge >= 29 AND DaysAge < 43 THEN Qty ELSE 0 END) AS Over4Weeks,
    SUM(CASE WHEN DaysAge >= 43 THEN Qty ELSE 0 END) AS Over6Weeks
FROM dbo.table_name
CROSS APPLY (
    SELECT DATEDIFF(DAY, GETDATE(), LineShipDate) AS DaysAge
) AS calc1
GROUP BY StockCode
ORDER BY StockCode
Thank you very much i was able to solve this issue. I will post data if i need more help.
For future .... excel list of data is oK or is there a better method to post the data?